Export a Map for Print and Design Tools
Turn one of your maps into a file for print or a design tool: a poster, a street banner, a flyer or a slide.
The Map Exporter starts from a map you built under Maps, with its list, style, view and colors. See Build and Share a Map first if you have none.
Open the exporter
- In the sidebar, click Maps.
- Click Edit on the map you want.
- At the top of the builder, click Print & Export.
The Map Exporter & Vector Studio opens in a new tab. You can also open it from the Your map is live panel: click Print or export, then Open the map exporter.
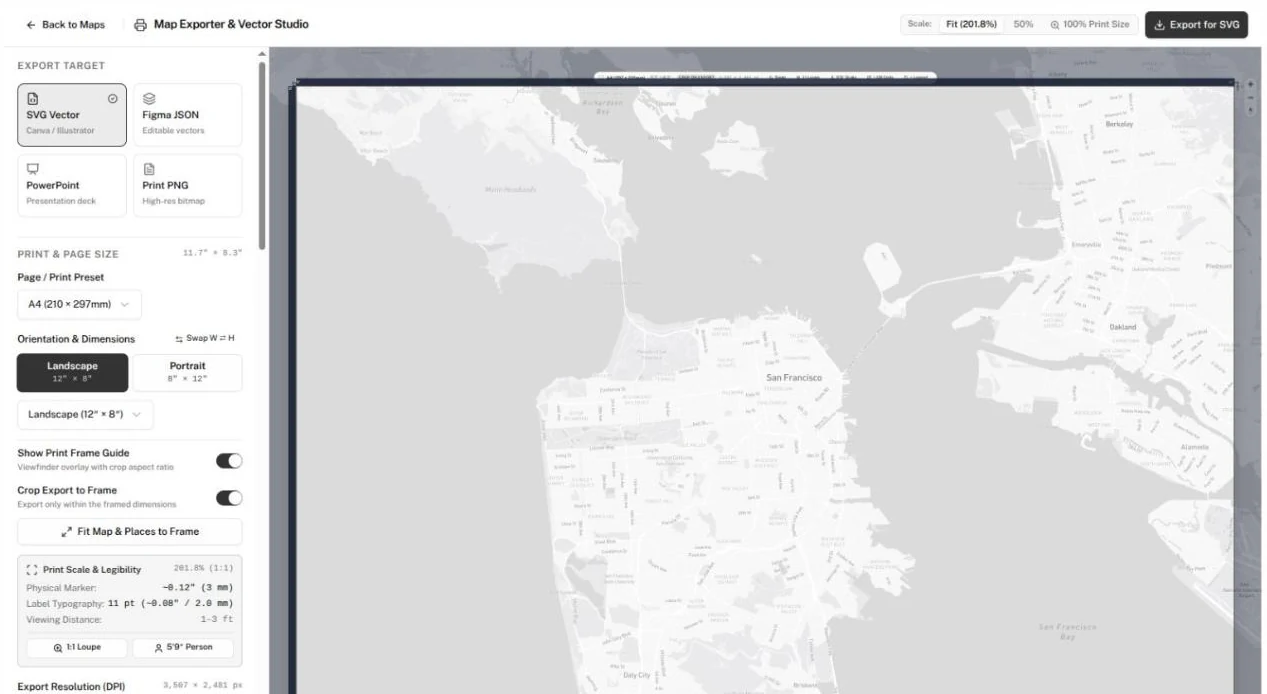
Settings sit in the panel on the left; the map preview fills the rest. Back to Maps returns to your maps.
Export a file
-
Under Export Target, pick a format:
Format Use it for You get SVG Vector Canva, Illustrator An .svgfileFigma JSON Editable vectors in Figma A .jsonfilePowerPoint A presentation slide A .pptxfilePrint PNG A high-resolution image for a printer A .pngfile -
Under Print & Page Size, pick a Page / Print Preset: 3' × 6' Banner (3 × 6 ft), 2' × 3' Poster (2 × 3 ft), 18″ × 24″ Sign / Print, Postcard (4″ × 6″), US Letter (8.5″ × 11″), A4 (210 × 297mm), A3 (297 × 420mm), or Custom Frame Dimensions… for any size in feet, inches, meters, centimeters or millimeters.
-
Under Orientation & Dimensions, choose Landscape or Portrait.
-
Turn on Show Print Frame Guide to see the page outline on the map. With the guide on, turn on Crop Export to Frame to export only what's inside it, or click Fit Map & Places to Frame to zoom the map until your places fit the frame.
-
Under Export Resolution (DPI), choose 96 DPI for Canva and screens, 150 DPI for vinyl banners or 300 DPI for commercial offset printing. Each option shows the pixel size it produces.
-
Click the export button at the top right. It names your format, such as Export for SVG.
The file downloads. A status message confirms the export or says why it failed.
For SVG, keep each side under 8,000 pixels for Canva. The panel warns you when a size and resolution go over; pick 96 DPI to fit.
Adjust the look
These sections shape the export:
| Section | What you set |
|---|---|
| Base Map Style | The map style, or a custom Mapbox style URL. |
| Marker Icons & Colors | What markers show (photos, icons, numbers or dots), category or single-color coloring, and marker size. |
| Marker Labels & Numbers | Place names on markers, their layout, font, size and color, and numbered circles. |
| QR Code & Digital Map | A QR code on the map, its Destination URL, Caption / Label, position, size and colors. |
| Map Legend & Key | A legend, its title, position, style and the categories it lists. |
| Places & Labels | Every place on the map. Click one to rename its label. |
| Map Element Colors | Colors for Land, Water, Streets, Buildings and Basemap Labels. |
| Map Layers & Overlays | Your custom layers and your district boundary, with line and fill colors. |
Two actions change more than the export:
- Map Element Colors → Save to Map saves those colors to the map you started from, so the live map uses them too. It appears once you change a color, and only when you opened the exporter with Print & Export from a published map.
- In a place's label editor, Save to Database renames the place in your directory, everywhere it appears. Apply Override renames the label in your exports only, and Reset to Original undoes it.
To send people from a printed QR code to the map itself, paste the map's link from Just need a link? on its Your map is live panel into Destination URL.